Resource Monitoring: Methods, Solutions, Services & Use Cases
Resource monitoring tracks CPU usage, memory, disk, and network bandwidth in Windows Resource Monitor to optimize system performance. Cloud resource monitoring and multi-server dashboards prevent downtime across VPS and storage resources.
What is Resource Monitoring?
Resource monitoring is the continuous process of measuring system performance metrics such as CPU usage, memory consumption, disk activity, and network bandwidth usage. It applies to physical servers, virtual machines, and cloud infrastructure.
According to Gartner, 60% of IT downtime incidents are detected through proactive monitoring before users are affected. Resource monitoring is the foundation of that detection.
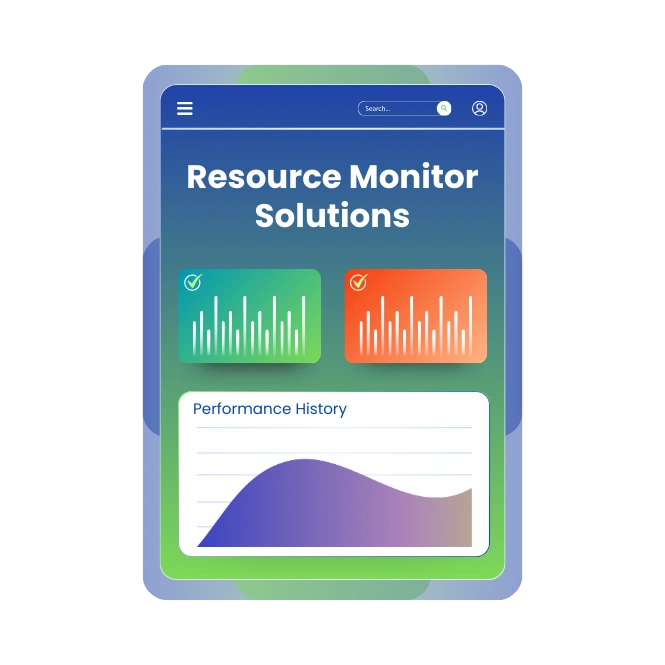
What Resource Monitor Solutions Are Available?
We provide 3 primary solution tiers: system-level monitoring, cloud resource monitoring, and managed monitoring services. Each tier covers specific infrastructure layers, from a single Windows machine to multi-cloud enterprise environments.
System Resource Monitoring
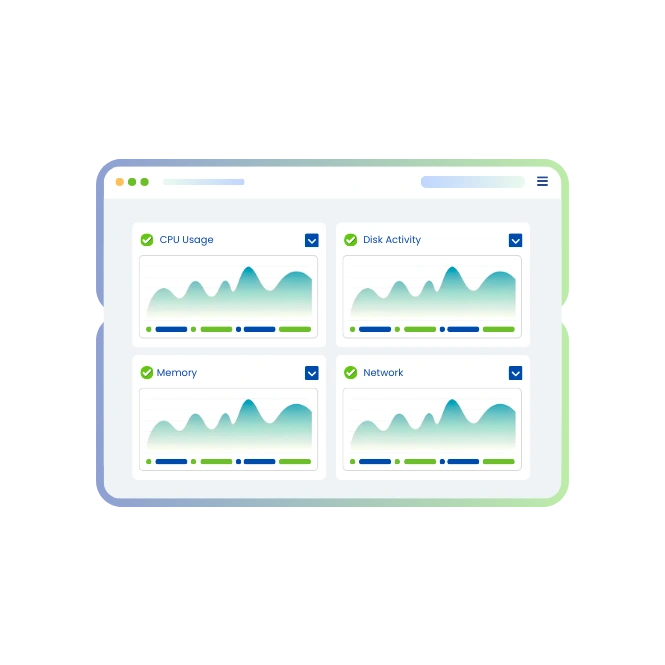
System resource monitoring measures performance data directly from the operating system. It tracks 4 key resources: CPU, memory, disk, and network. Tools range from built-in OS utilities to third-party agents.
Task Manager
Task Manager is a built-in Windows tool that displays real-time CPU, memory, disk, and network usage per process. It supports 5 tabs: Processes, Performance, App History, Startup, and Services.
Process Explorer
Process Explorer is a Microsoft Sysinternals utility. It provides deeper process-level data than Task Manager, including DLL usage, handle counts, and parent-child process trees.
Linux Monitoring Tools
Linux includes 6 native monitoring tools: top, htop, vmstat, iostat, netstat, and sar. Each targets a specific resource layer. htop provides an interactive, color-coded CPU and memory view. iostat focuses on disk I/O throughput.
Cloud Resource Monitoring
Cloud resource monitoring tracks compute, storage, and network consumption across cloud platforms such as AWS, Azure, and GCP. It enables capacity planning, cost optimization, and performance alerting across distributed infrastructure.
VPS Monitoring
VPS monitoring checks CPU allocation, RAM usage, disk I/O, and bandwidth on virtual private servers. Alerts trigger when resources exceed defined thresholds. This prevents oversaturation on shared hosting environments.
SIEM Integration
SIEM (Security Information and Event Management) systems aggregate and analyze resource and security event logs in real time.
Windows Resource Monitor (resmon.exe)
Windows Resource Monitor, launched via resmon.exe, provides granular process-level data across 4 tabs: CPU, Memory, Disk, and Network. It is more detailed than Task Manager and is built into Windows Vista and later versions.

CPU Tab
The CPU tab in resmon.exe shows per-process CPU usage, CPU cycles, and thread count. It identifies processes consuming the most CPU cycles in real time.

Memory Tab
The Memory tab displays physical memory usage in MB per process. It shows 5 memory states: In Use, Modified, Standby, Free, and Hardware Reserved.

Disk Tab
The Disk tab in Windows Resource Monitor shows read/write speeds per process in KB/s. It identifies processes causing high disk activity, which is a common root cause of slow PC.

Network Tab
The Network tab displays bytes sent and received per process. It shows active TCP connections and listening ports, enabling identification of unexpected network bandwidth usage.

Resource Monitor for Mac
Mac uses Activity Monitor as its native resource monitoring tool. Activity Monitor displays CPU and memory via the utilities folder. Graphs network activity across multiple adapters.
Resource Monitor for Linux
Linux resource monitoring uses command-line tools and GUI applications. top and htop display CPU and memory per process. Glances provides a unified real-time dashboard.
Comprehensive Website Monitoring Solutions
We provide 10 core monitoring services to safeguard every aspect of your digital infrastructure with enterprise-grade reliability.
Website Monitoring
Monitor your website's uptime, performance, and response time from over 100 global locations to ensure optimal user experience.
SSL Monitoring
Track your SSL/TLS certificates for expiration, validity, and configuration errors to prevent security warnings.
Ping Monitoring
Check server availability and network latency with lightweight ICMP ping commands.
Port Monitoring
Scan critical service ports (e.g., 80, 443, 21, 22) for accessibility and status.
API Monitoring
Validate API endpoint functionality, response time, status codes, and payload correctness.
Cron Job Monitoring
Verify your scheduled tasks (cron jobs) execute on time and complete successfully.
Keyword Monitoring
Confirm the presence, rank, and appearance of specific keywords on your web pages.
Resource Monitoring
Observe server health metrics in real-time, including CPU, Memory, and Disk Space usage.
DNS Monitoring
Audit DNS records for propagation delays, misconfigurations, and poisoning attacks.
Domain Monitoring
Watch your domain registration details to prevent accidental expiration and hijacking.
Public Statuspage
Communicate service status and incidents to users with a transparent, real-time status page.
What are the Benefits and Uses of Resource Monitoring?
Resource monitoring delivers 5 measurable operational benefits: faster troubleshooting, centralized visibility, cloud cost reduction, enhanced security, and capacity optimization. Organizations using proactive monitoring report 40% faster incident resolution times
Troubleshooting Slow PC
A slow PC is caused by 4 common resource bottlenecks: high CPU usage, memory exhaustion, disk saturation, or network congestion. Windows Resource Monitor (resmon.exe) identifies which process consumes the most resources within seconds.
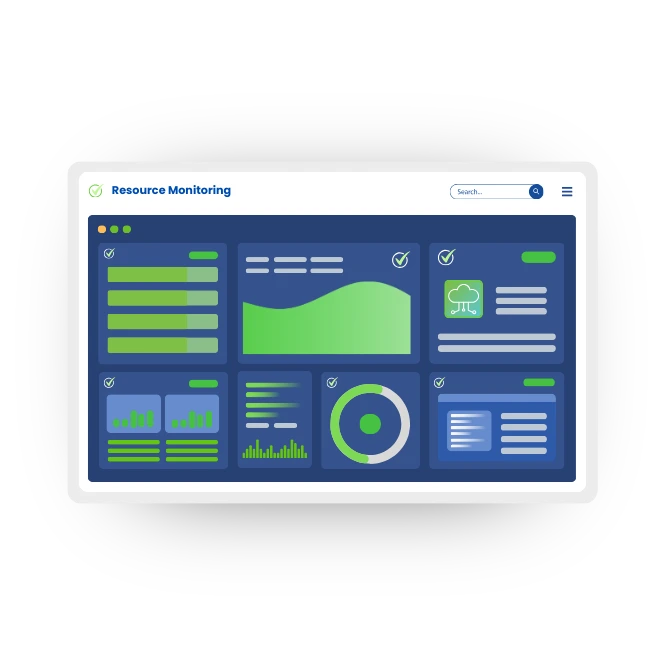
Centralized Dashboard for Multiple Servers
A centralized monitoring dashboard aggregates metrics from multiple servers into a single view. It reduces mean time to detect (MTTD) by eliminating the need to log into each server individually. Teams managing 10 or more servers see the highest efficiency gains.
Monitoring Cloud Capacity
Cloud capacity monitoring tracks resource utilization against provisioned limits. It prevents two failure modes: over-provisioning (wasted spend) and under-provisioning (performance degradation). AWS, Azure, and GCP all expose native metrics consumable by third-party monitors.
Enterprise Security Monitoring
Enterprise security monitoring correlates resource spikes with security events. Sudden CPU or network bandwidth usage increases can indicate cryptomining malware, DDoS attacks, or data exfiltration. SIEM tools integrate resource data with threat intelligence feeds.
Cost Optimization
Resource monitoring identifies underutilized servers and cloud instances. Rightizing over-provisioned VMs based on actual CPU and memory usage reduces cloud spend. Studies show organizations save an average of 23% on cloud bills after implementing usage-based rightsizing.
Resource Monitoring Methods
Three monitoring methods exist: real-time, passive, and query-based.
- Real-Time Monitoring : Collects metrics at 1–60 second intervals for production systems requiring immediate detection.
- Passive Monitoring : Analyzes logs and traffic without generating additional requests.
- Query-Based Monitoring : Executes targeted checks like SQL queries, HTTP requests, or SNMP polls.
How to Choose the Right Resource Monitoring Setup?
The right monitoring setup depends on 3 factors: infrastructure size, budget, and required customization. There are 3 deployment models: native OS tools, SaaS-based platforms, and open-source solutions.

Native OS Monitoring
Native OS monitoring uses built-in tools such as Windows Resource Monitor, Activity Monitor on Mac, and top/htop on Linux. It costs nothing but lacks alerting, historical data retention, and multi-server visibility.

SaaS-Based Monitoring
SaaS-based monitoring platforms require no infrastructure setup. They deliver alerting, dashboards, and reporting out of the box. Pricing models are typically per-monitor or per-host.

Open-Source Monitoring
Open-source monitoring tools such as Prometheus, Grafana, Nagios, and Zabbix are free but require self-hosting and configuration. They suit teams with DevOps expertise and specific customization needs.
Server Down? Get Instant Alerts
Alerting triggers notifications within 60 seconds of downtime through email, SMS, Slack, PagerDuty, or webhooks. Escalation rules route alerts correctly.
Explore integrations

How to Monitor Multiple Servers from One Dashboard
Centralized monitoring requires installing lightweight agents, configuring metric collection, and connecting hosts to a unified dashboard across Windows, Linux, and cloud VMs.
Who Needs Resource Monitoring?
Resource monitoring is used by IT administrators, developers, e-commerce owners, and SaaS companies. Each group has distinct monitoring priorities and alert requirements.
IT Administrators
IT administrators use resource monitoring to manage server health across on-premises and hybrid environments. Key metrics include CPU utilization, disk capacity, and memory headroom. Proactive alerts reduce after-hours incident response.
Developers
Developers monitor application performance metrics (APM) alongside infrastructure data. They track memory leaks, CPU spikes tied to code deployments, and API response time degradation. Resource monitoring connects infrastructure behavior to application releases.
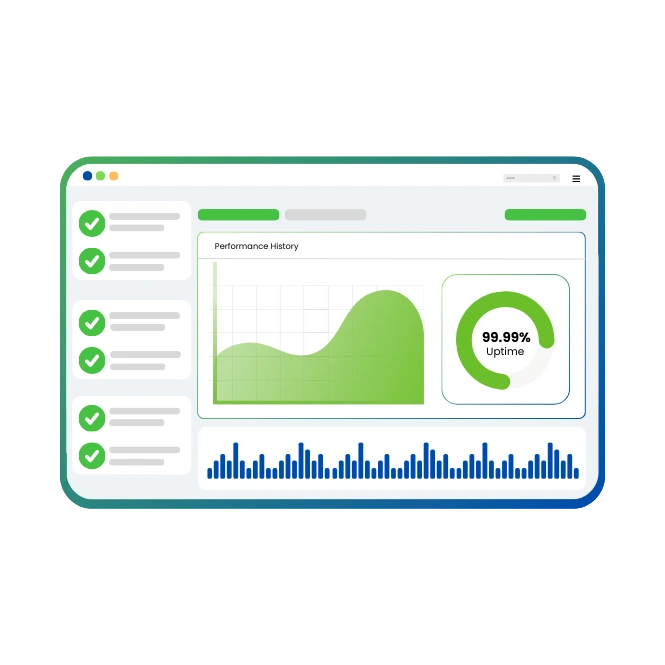
E-commerce Owners
E-commerce platforms require 99.9%+ uptime. Resource monitoring ensures servers handle traffic spikes during sales events. A 1-second delay in page load time reduces conversions by 7%. Monitoring prevents revenue loss from degraded performance.
SaaS Companies
SaaS companies use resource monitoring to enforce SLA commitments. Multi-tenant environments require per-customer resource tracking to prevent noisy neighbor effects. Cloud resource monitoring enables automated scaling triggers.
How Webstatus247 Helps Monitor Resources
Webstatus247 combines external uptime checks, internal system resource monitoring, and alert management in a single interface. It supports 8 check types, 5 alert channels, and global probe nodes across 3 continents. Setup takes under 5 minutes per monitor with no agent required for external checks.
How Do I Disable the Resource Monitor?
Windows Resource Monitor (resmon.exe) is disabled by stopping the "Diagnostic Policy Service" in services.msc. Alternatively, it is blocked via Group Policy under Computer Configuration > Administrative Templates > System > Troubleshooting and Diagnostics.
Is There a Way to Disable Monitors?
Individual monitors in a monitoring platform are paused or disabled from the dashboard. This suspends alerting without deleting configuration. Pausing is useful during planned maintenance windows to avoid false-positive alerts.
What is Resmon.exe in Windows?
Resmon.exe is the Windows Resource Monitor executable located in C:\Windows\System32\. It is a legitimate Windows system file signed by Microsoft. It provides process-level data across CPU, Memory, Disk, and Network tabs and is safe to run.
Should Resmon.exe Be Deleted from Windows?
Resmon.exe is a core Windows system file. Deleting it removes the built-in resource monitoring capability and may affect system stability. It is not recommended to delete resmon.exe under normal circumstances.
What is the Difference Between Resource Monitoring vs Task Manager?
Task Manager provides a high-level overview of system resource usage. Windows Resource Monitor provides deeper, process-level data including disk I/O per file, network connections per process, and memory working sets. Resource Monitor is the more detailed diagnostic tool.
Resource monitoring spans 3 infrastructure layers: the OS level, server level, and cloud level. Together, system performance monitoring tools and external uptime checks form a complete observability stack that reduces downtime, cuts costs, and improves response times.