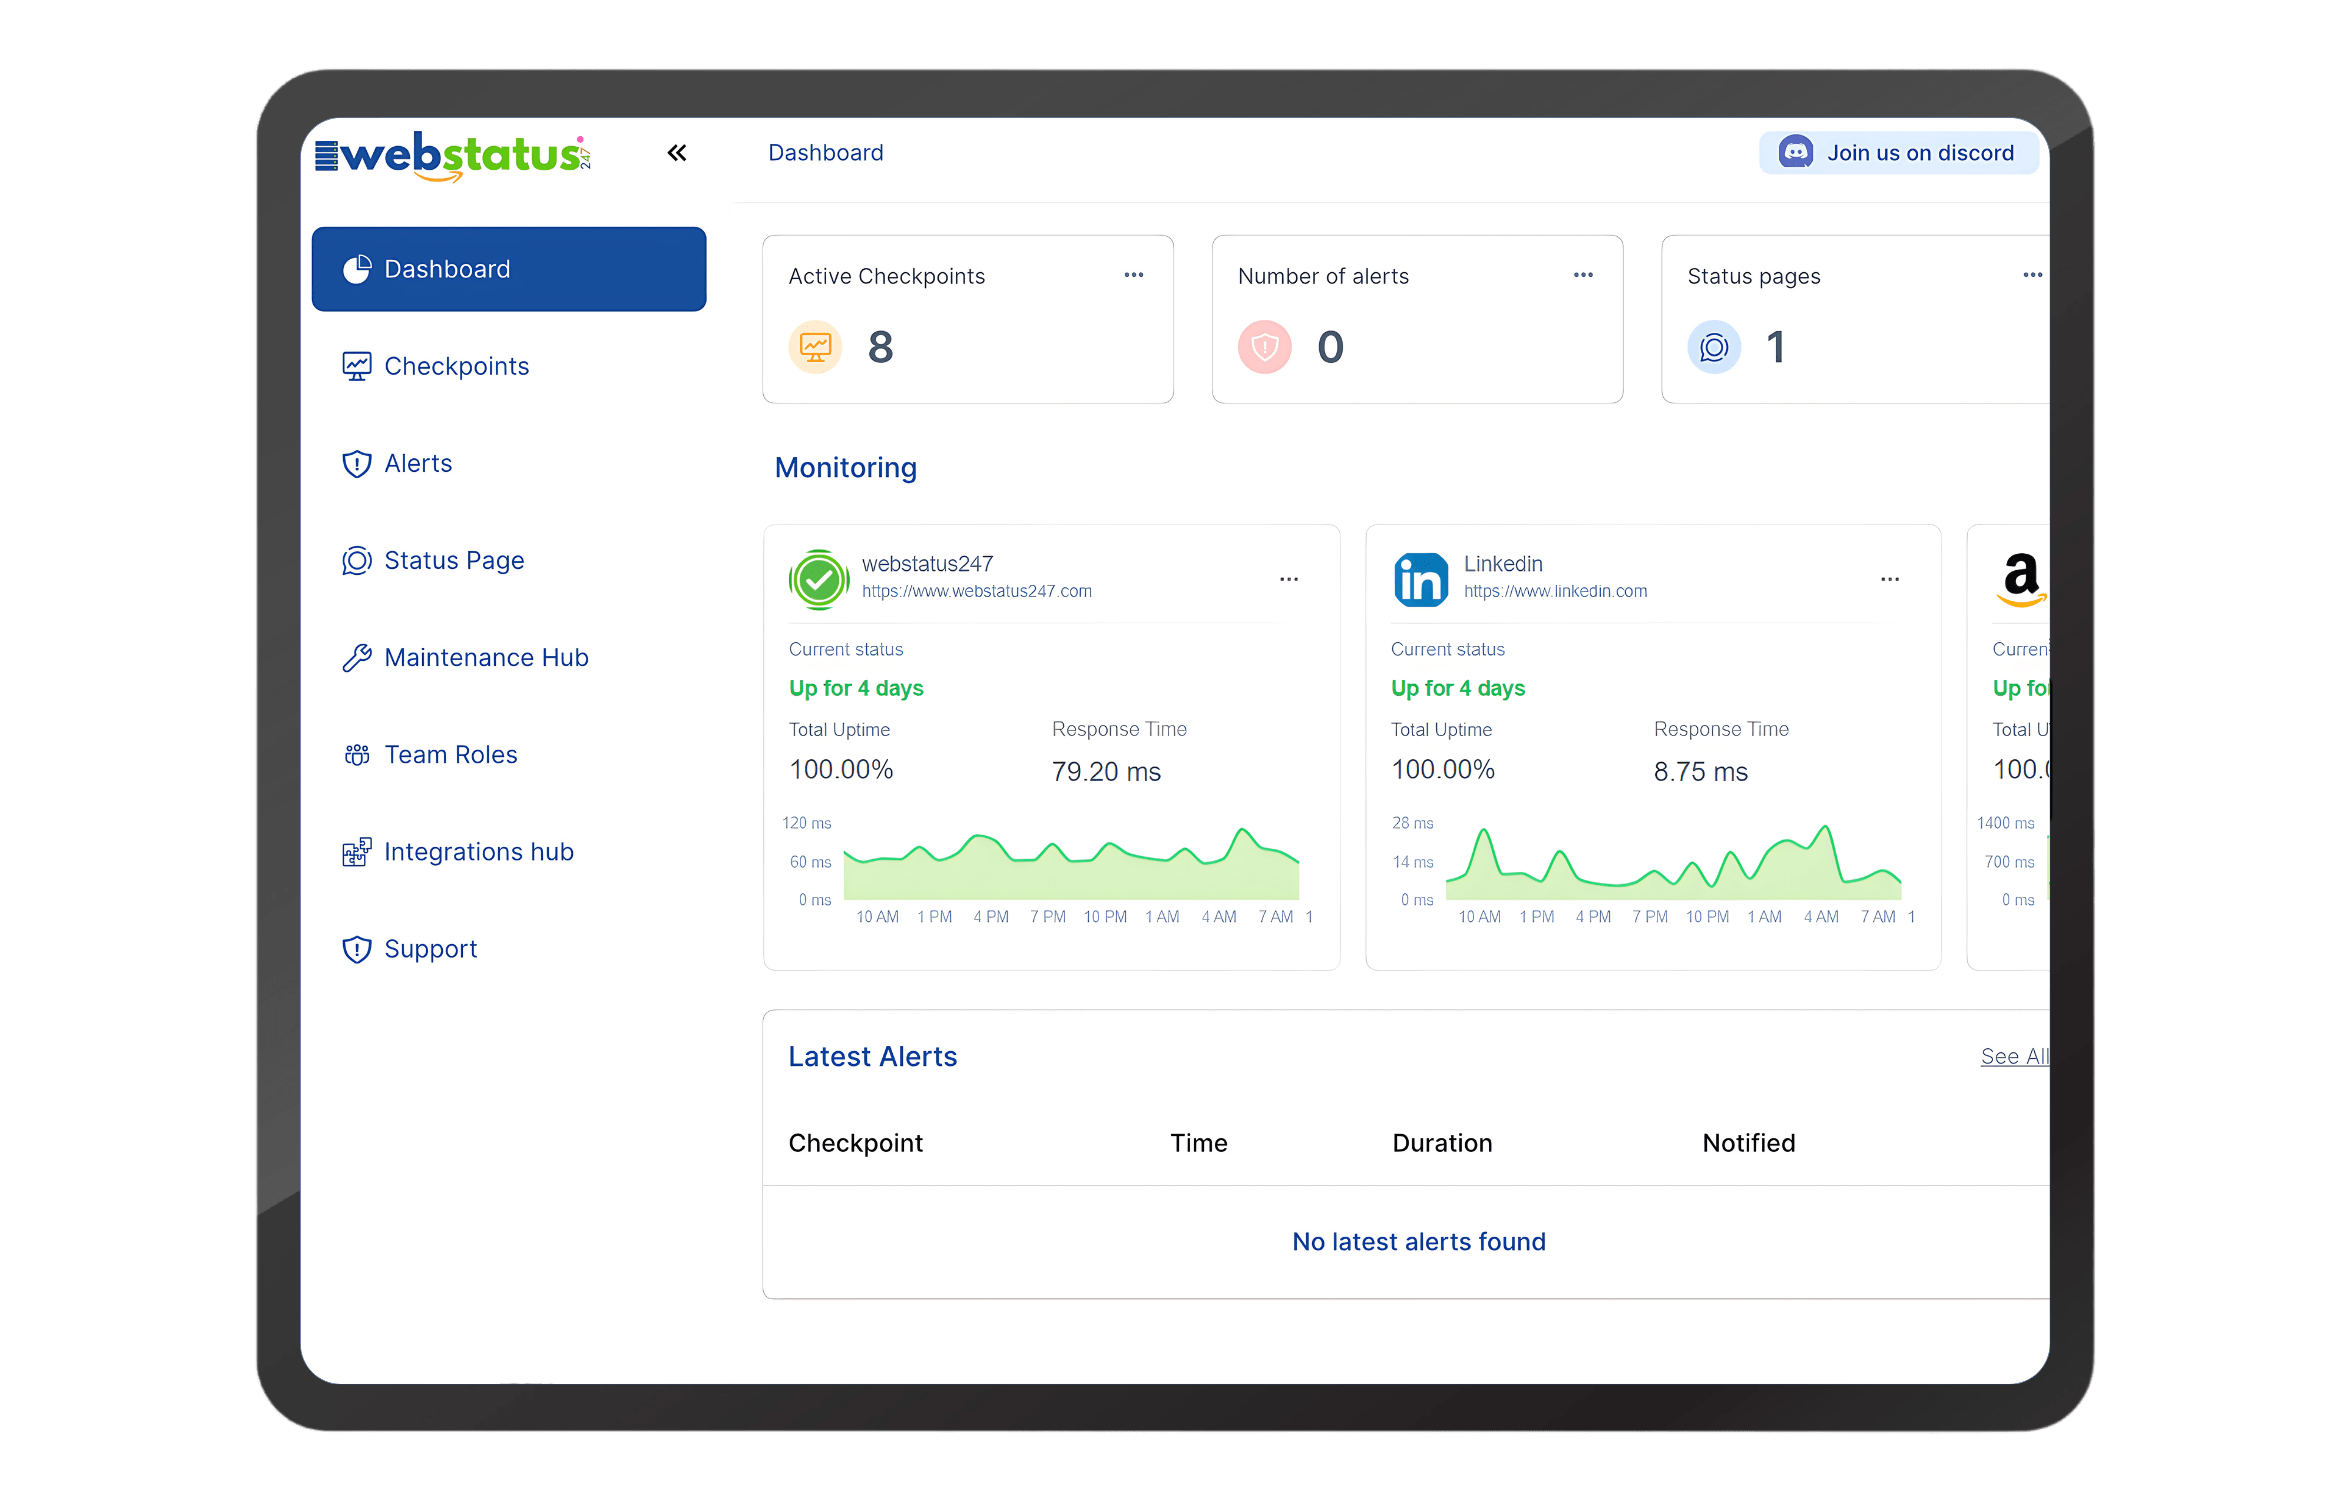
Website monitoring features
Website monitoring platforms group features into core availability checks, performance analytics, geographic coverage, alerting, reporting and integration capabilities Uptime and availability checks.
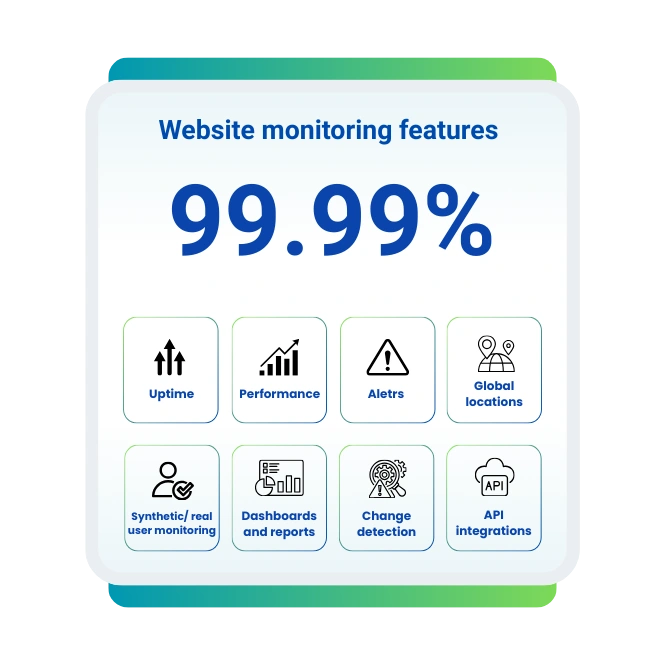
Availability and uptime monitoring
Availability and uptime monitoring track whether websites and services are reachable and responsive across defined time periods. Uptime is calculated as total time online divided by total observation time and expressed as a percentage.
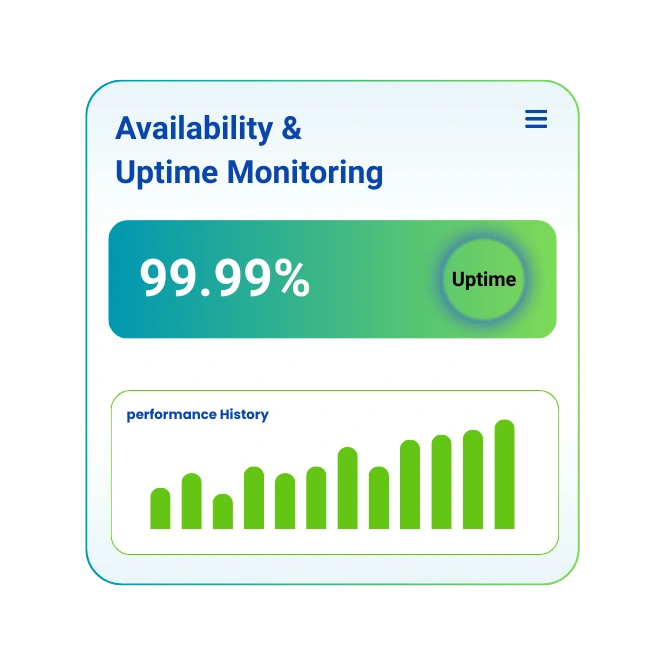
Performance monitoring
Performance monitoring measures how quickly pages load, assets render and interactions complete for users across devices and networks. Performance is known to influence bounce rate, conversion rate and search rankings because slower pages increase abandonment.
Latency
Latency describes the time data needs to travel between user or probe and server, usually measured in milliseconds. Latency depends on geographic distance, routing paths, ISP peering and CDN presence.
Response time
Response time measures how long servers and applications need to process a request and send a usable response. Time to First Byte is known for exposing backend delays from code execution, database queries and server configuration.
Error rates
Error rate monitoring tracks the proportion of failed requests, such as HTTP 4xx, 5xx, DNS errors and timeouts, over defined intervals. HTTP 4xx errors usually indicate client‑side or request issues, while HTTP 5xx errors signal server‑side failures and overload.
Global website monitoring from 10 locations worldwide
We monitor global locations and simulate user access from multiple countries, continents and networks to expose geographic differences in availability and performance.
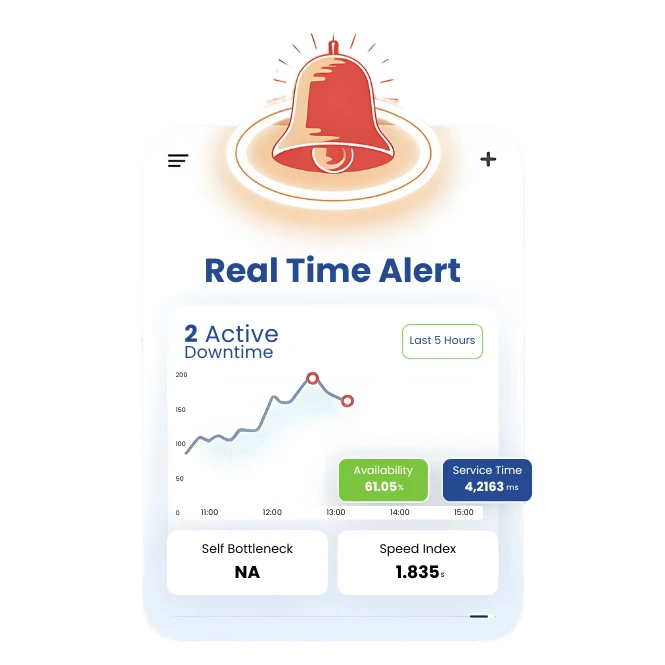
Downtime happens. Get instant alerts
Downtime alerts form the incident‑response backbone of website monitoring platforms. Instant alerts reduce detection time so teams fix issues before users widely experience failures.
Explore integrations
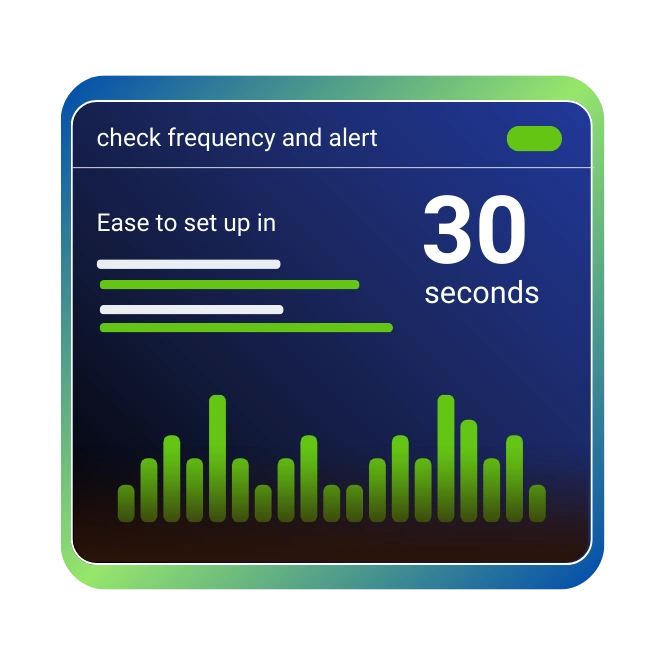
Easy to set up Dashboard in 30 seconds
Modern website monitoring SaaS tools prioritize quick onboarding with minimal configuration steps. Setup flows often request only URL, check frequency and alert channels so users start tracking availability within 30–120 seconds.
Website monitoring tools and services
Website monitoring tools and services deliver ready‑to‑use infrastructure for uptime tracking, performance metrics and incident alerts. SaaS‑based services offload maintenance burden and provide continuous feature updates, global probe networks and integrations.
Website Monitoring
Monitor your website's uptime, performance, and response time from over 100 global locations.
SSL Monitoring
Track your SSL/TLS certificates for expiration, validity, and configuration errors to prevent security warnings.
Ping Monitoring
Check server availability and network latency with lightweight ICMP ping commands.
Need More Monitoring Solutions?
We offer specialized monitoring services including API, DNS, Cron Jobs, and more.
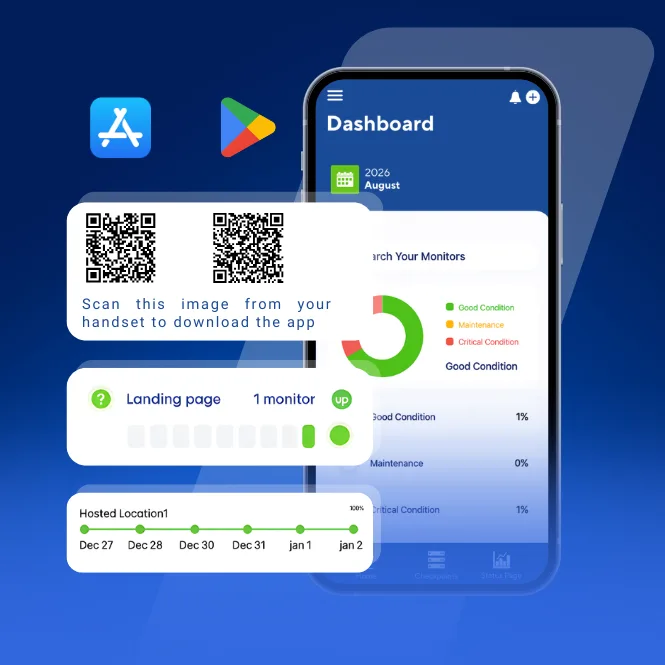
WebStatus247 Mobile App is Now Live
Stay connected to your monitoring dashboard 24/7 with the official WebStatus247 mobile app. Receive instant downtime alerts, monitor real-time performance metrics, track response times, and stay informed about your website's health — anytime, anywhere, directly from your smartphone.
What Free Website Monitoring Tools Does WebStatus247 Offer?
We provide essential free tools for instant diagnostics and checks.
Website Speed Test
Analyze the uptime history and performance metrics of a URL.
Ping Test
Test the reachability and latency of a server from your location.
HTTP Status Decoder
Decode the meaning of any HTTP status code (e.g., 404, 500, 301).
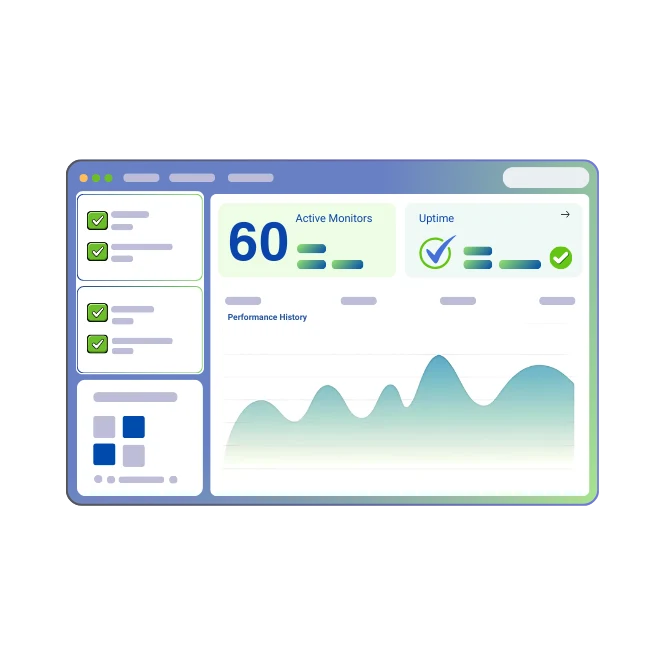
Prevent downtime. Get free account with 60 monitors
Our Freemium monitoring plans offer free accounts with a limited number of monitors, which lowers adoption barriers and enables evaluation on real production websites.
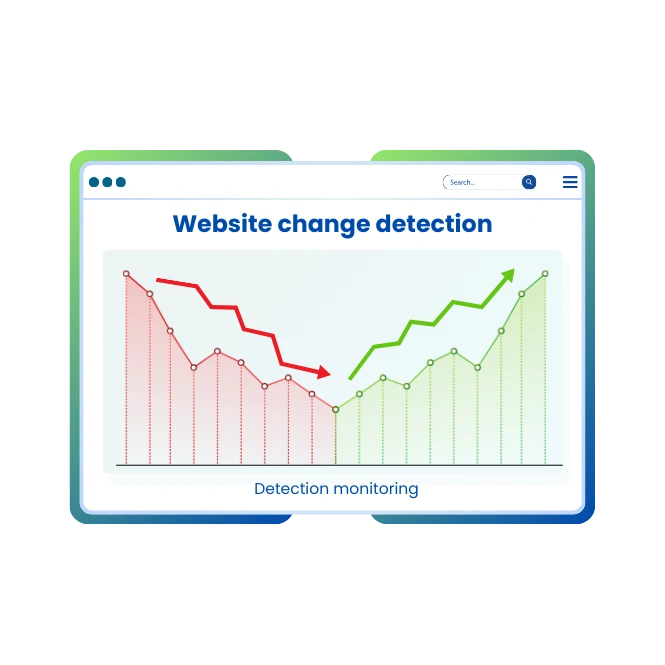
Website change detection
Website change detection monitors content, code and layout modifications across web pages and resources. This helps detect unauthorized changes, misconfigurations and unexpected SEO‑critical updates.
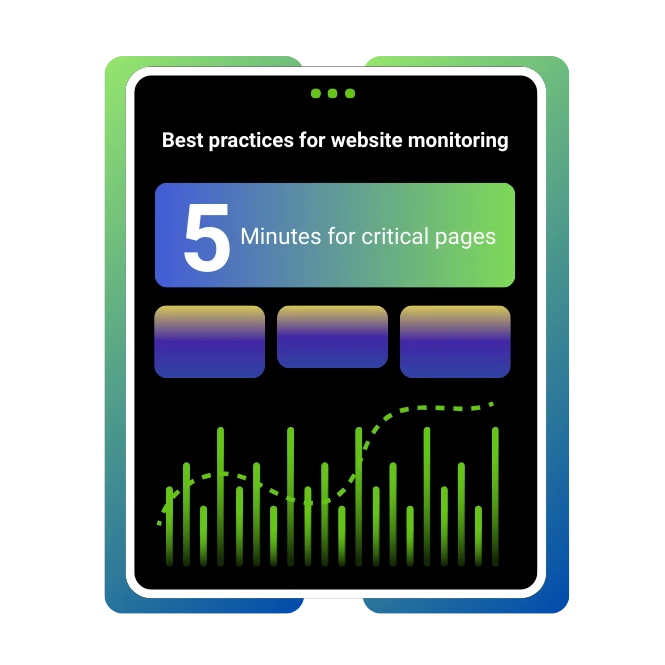
Best practices for website monitoring
Website monitoring best practices focus on frequency, coverage and clear processes. Well‑designed strategies reduce blind spots and unnecessary noise. Important best practices include:
- Monitor every public endpoint that supports revenue or lead generation.
- Use multiple locations for each check to avoid regional blind spots.
- Configure check frequencies between 1 and 5 minutes for critical pages.
- Combine uptime checks with performance thresholds and error‑rate alerts.
- Maintain incident runbooks describing detection, triage and resolution steps.
Our Best Website Monitoring Plan
Our Professional Plan is the optimal solution for businesses requiring comprehensive coverage. It includes 5-minute check intervals, all 10 monitoring services (SSL, Port, API, etc.), 10 advanced keyword monitors, and alerts via 5 channels (Email, SMS, Slack, Discord, Webhook). This plan is designed for e-commerce stores, SaaS platforms, and any business where website reliability is critical to revenue.
Basic
Perfect for personal projects & testing
- 60 monitoring checkpoints
- Port Monitor
- Ping Monitor
- Webpage Monitor
- 1 Resource Monitor
- 5 Min Ping interval
- 0 Teams
- 1 Cron Jobs
- 2 Status Pages
- 10 Subscribers
- 3 Locations
Starter
For growing businesses & e-commerce
$4.95/mo billed annually (Save 20%)
- 25 Monitors
- Port Monitor
- Ping Monitor
- Webpage Monitor
- Domain Monitor
- SSL Monitor
- 3 Resource Monitor
- 60 Sec Ping interval
- API
- 0 Teams
- 3 Cron Jobs
- 10 Status Pages
- 250 Subscribers
- 5 Locations
Premium
Enterprise-grade monitoring with SLA
$19.95/mo billed annually (Save 20%)
- 50 Monitors
- Port Monitor
- Ping Monitor
- Webpage Monitor
- API Monitor
- Domain Monitor
- SSL Monitor
- DNS Monitor
- 15 Resource Monitor
- 30 Sec Ping interval
- API
- 3 Teams
- 20 Cron Jobs
- 5 Status Pages
- 1500 Subscribers
- 10 Locations
Long-Term Plans & Savings
*Lifetime terms apply. SLA & enterprise add-ons available.
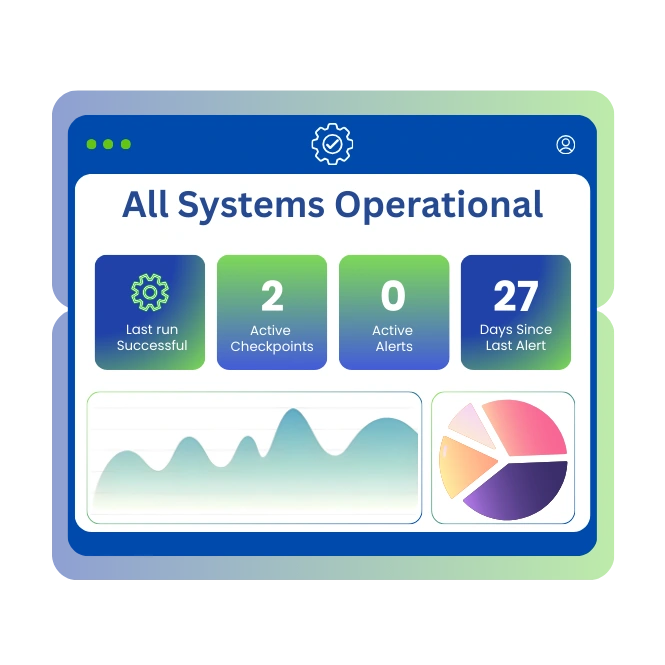
Reliable Status Insights
Get clear, real-time visibility into your website’s health
99.99% Uptime SLA
Enterprise-grade reliability
GDPR Compliant
Data privacy guaranteed
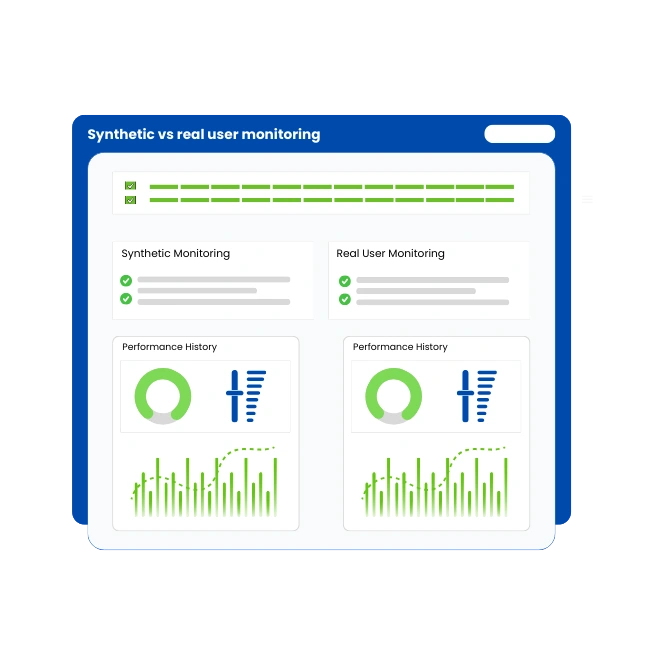
Synthetic vs real user monitoring (RUM)
Synthetic monitoring uses scripted, scheduled requests from controlled locations to test availability and performance for defined paths. Real user monitoring (RUM) collects performance data from actual visitors via client‑side agents embedded in pages.
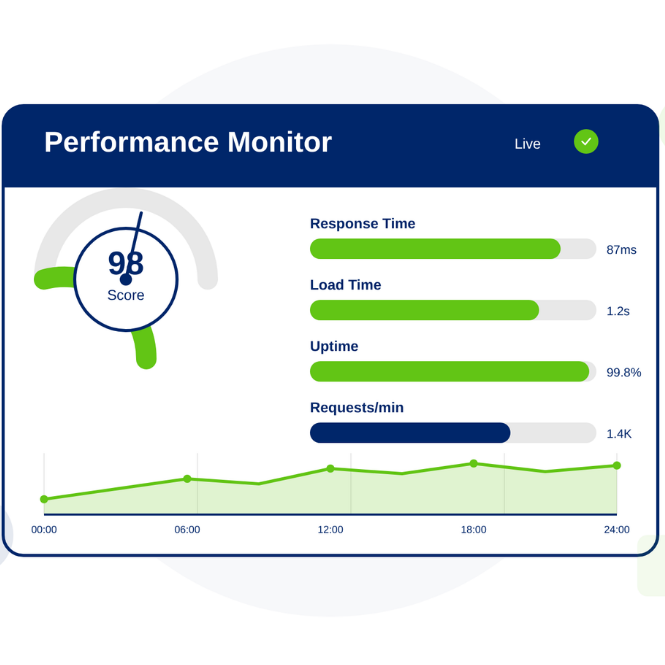
Check downtime incidents with status pages for outages detection
Public status pages present live and historical service health to our customers and partners. Status pages are known for increasing transparency and reducing support tickets during downtime incidents.
Teams Worldwide Choose WebStatus247
Join thousands of engineering teams who trust our monitoring platform for their critical infrastructure
“WebStatus247 identified an API degradation in under 40 seconds — faster than any tool we used before.”
Lucas Pereira
DevOps Lead,
“Our Mean Time To Resolution dropped by 60% after adopting WebStatus247. Total game changer.”
Sarah Williams
CTO,
“We used the free plan at first — 30-second checks revealed issues our old tools completely missed.”
Daniel Kim
Founder,
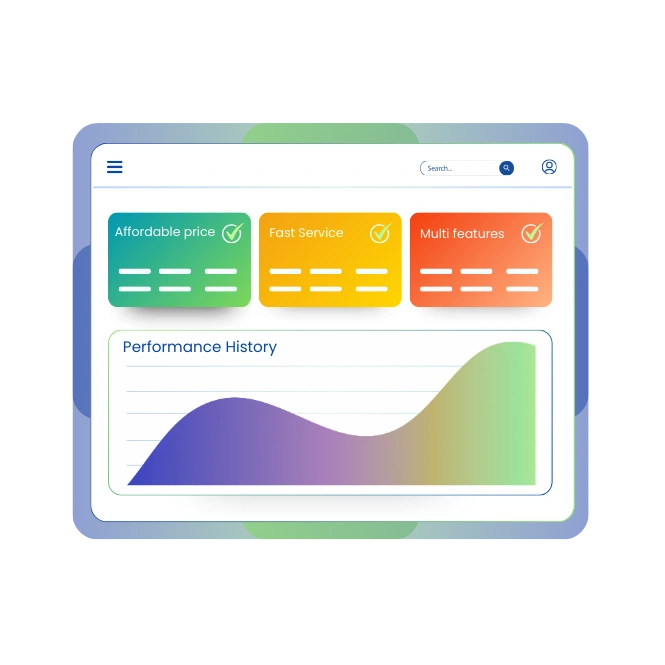
Why choose WebStatus247 for website monitoring
WebStatus247 as a best‑fit website monitoring solution for availability, performance, uptime and alerts. Commercial users evaluate reasons to adopt a dedicated platform rather than managing scripts or fragmented tools. Important selection attributes include:
- Fast Service
- Affordable price with Life time budget
- Multi features in services
- Globally monitoring available
What is Website Monitoring?
Website monitoring is the practice of continuously checking a website to ensure it is online, fast, secure, and working correctly for users.
How does website monitoring work?
Website monitoring uses global checkpoints that ping your site every 1-5 mins via HTTP requests, checking response codes (e.g., 200 OK), content, load times & transactions. Alerts on errors/downtime.
How website monitoring differs from simple uptime checks ?
Basic uptime checks only test whether a server responds with any HTTP status and often runs from a single location. Website monitoring extends this by measuring performance, availability, transactions, third‑party dependencies and regional behavior. Key differences include:
- Website monitoring includes performance metrics, error rates and synthetic journeys.
- Website monitoring uses multiple global locations and confirms incidents from several probes.
- Website monitoring integrates with alerts, dashboards and status pages.
Will monitoring slow down a site
Website monitoring uses external synthetic checks that run from monitoring nodes to website endpoints, which means it does not place load inside the application. Each check is a lightweight HTTP or ping request comparable to a single user visit, so overall traffic impact remains negligible even with frequent intervals.
How often to run checks
Monitoring frequency depends on business criticality, expected traffic and tolerance for detection delay. Critical transactional pages like checkout and login often use 1‑minute intervals, while less critical informational pages use 5–15‑minute intervals. Benchmarks suggest:
- 1‑minute checks for core revenue paths and APIs.
- 3‑minute checks for secondary journeys like account management.
- 5–15‑minute checks for static marketing or documentation pages.
How website monitoring detects downtime?
Website monitoring detects downtime when checks consistently fail to reach endpoints or receive error responses within defined timeouts. Detection mechanisms include ping failures, HTTP status codes like 5xx, timeouts and TLS handshake errors.